the idea
cinemetrics is about measuring and visualizing movie data, in order to reveal the characteristics of films and to create a visual
“fingerprint” for them. Information such as the editing structure, color, speech or motion are extracted, analyzed and transformed into graphic representations so that movies can be seen as a whole and easily interpreted or compared side by side.
read more ...
Being someone who really enjoys movies and cinema, I always notice little things about the style of a movie, so film and its characteristics were an interesting starting point for this project. Furthermore my thesis is about generative / computational design and what role writing code plays regarding new approaches in (graphic) design. It was clear that for my graduation project I would use the methods I described in the thesis and that it would involve a certain amount of programming in order to visualize data. However, today there are already a lot of information graphics using meta-data related to film and cinema (budget, box office data, awards won, relationship between characters etc.). That’s why I wanted to use the movie itself as a source of data, to see what sort of information can be extracted from it, to find ways of visualizing it and to create the necessary tools to do this.
Since motion pictures are a time-based medium, they can only be seen one image at a time – only as a fraction, never as a whole – that’s why it’s hard to capture and display them in their entireness. Taking this as a challange, the goals I set for this project were the following:
- Measuring and visualizing movie data to reveal the characteristics of movies and to create some sort of unique “fingerprint” for them.
- Extracting and analyzing information – such as the editing structure, use of colors, speech or motion – and transform them into graphic representations, so that movies can be seen as a whole and easily be interpreted or compared.
- Working experimentally and presenting the work both in print and digital media.
This is especially interesting when putting two or more movies side by side and to be able to immediately see the similarities and / or differences:
- original vs. remake
- movies of the same genre / series
- different epochs of film-making
- all movies by one director
Not only cinema enthusiasts and people doing film studies might benefit, but also for regular people an alternative way of looking at movies could provide an interesting new way of choosing movies based on formal criteria.
For instance:
“I don’t want to see the dark one with lots of motion, that colorful one with the great amount of spoken words looks much more interesting to me.”
cinemetrics is an experiment to find out if the data that is inherent in the movie can be used to make something visible that otherwise would remain unnoticed.
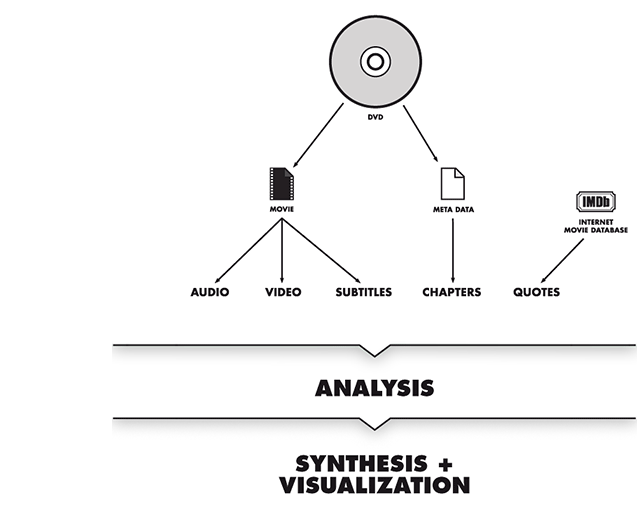
The workflow schematically looks like this:
the tools
Extracting, processing and visualizing movie data is something you cannot do manually, that's why custom software tools were written for pretty much every step of the process. – Tools for disassembling video files into their components (video, audio, subtitles, etc.) and processing them (shot detection, average shot length, motion measuring, color palettes), as well as an interactive application to generate and compare different movie fingerprints. Most of the
code is available here.
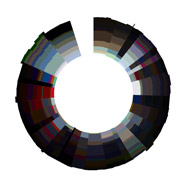
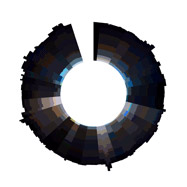
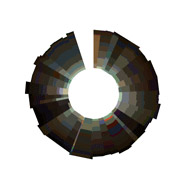
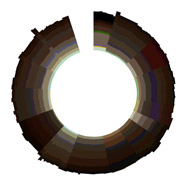
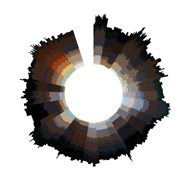
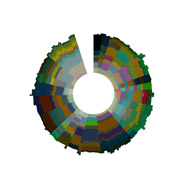
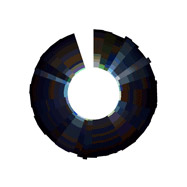
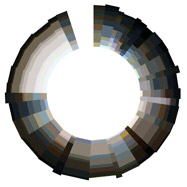
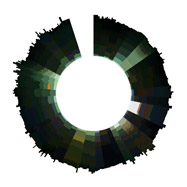
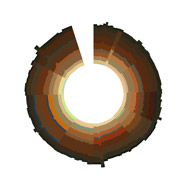
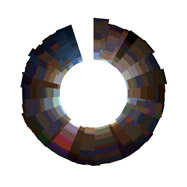
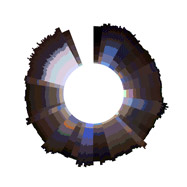
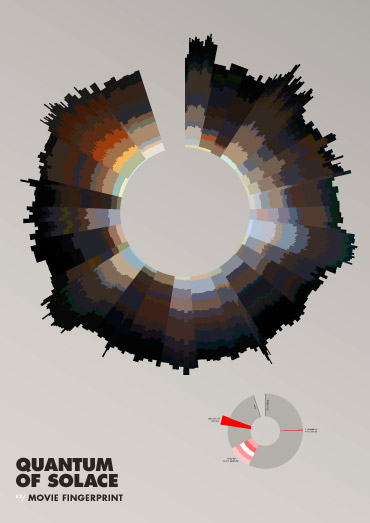
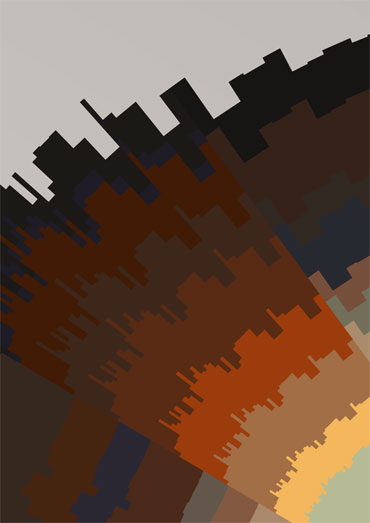
the fingerprints
The results can be quite diverse. Here's a selection of the films I have analyzed so far. Use your cursor to reveal the title of the movie.
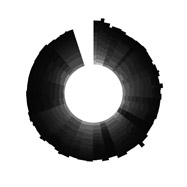
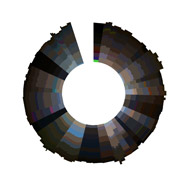
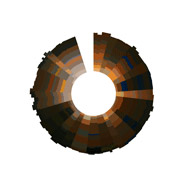
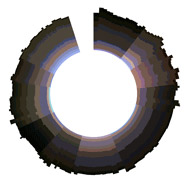
2001: a space odyssey
alien
annie hall
casablanca
007: dr. no
fantastic mr. fox
papillon
pulp fiction
quantum of solace
the simpsons movie
solaris
solyaris
the matrix
the royal tenenbaums
the shining
top gun
the posters
The accompanying poster series shows the most important steps of the process. It explains where the data comes from, what techniques I have been experimenting with to analyze and process it and how a typical data set of a movie looks like. There is a diagram that shows how a movie fingerprint works and why it looks the way it does, an overview of all the movies I analyzed, and it features three other experiments of how a movie could be visualized in one image with different levels of abstraction.
the book
The process book is a more in-depth summary of my work. It contains the exposé, a description of my approach, the results of my research, early sketches and intermediate stages of the project and an inventory of the final results.


